View this notebook on GitHub or run it yourself on Binder!
Logging Plots as PNGs
rubicon_ml makes it easy to log Plotly plots and images with artifacts. In this example we’ll walk through creating a plot using plotly.express and saving it as an artifact.
Before getting started, we’ll have to install some dependencies for this example.
[1]:
! pip install kaleido Pillow
Requirement already satisfied: Pillow in /Users/nvd215/mambaforge/envs/rubicon-ml-dev/lib/python3.10/site-packages (9.2.0)
Set up
First lets set up our rubicon_ml project.
[2]:
import os

from rubicon_ml import Rubicon


rubicon = Rubicon(persistence="memory")
project = rubicon.get_or_create_project("Artifact Plots")
Next, create plotting data. This example leverages plotly and plotly.express for data and plot generation.
[3]:
import plotly.express as px
from plotly import data


df = data.wind()
df.head()
[3]:
| direction | strength | frequency | |
|---|---|---|---|
| 0 | N | 0-1 | 0.5 |
| 1 | NNE | 0-1 | 0.6 |
| 2 | NE | 0-1 | 0.5 |
| 3 | ENE | 0-1 | 0.4 |
| 4 | E | 0-1 | 0.4 |
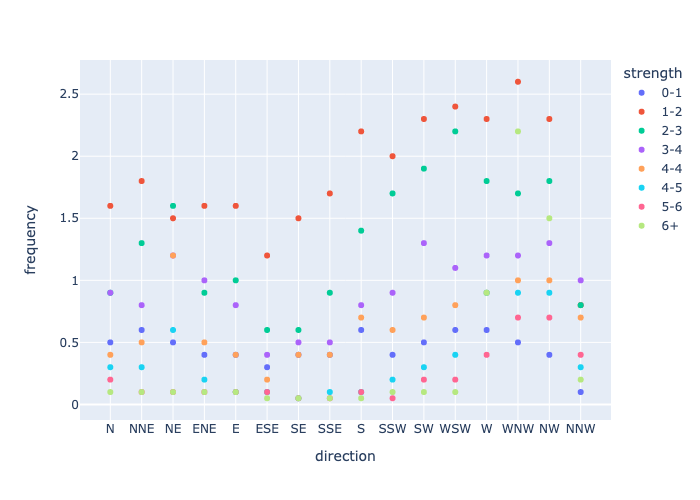
Using the plotting data generated, create a plot and save it to a file. Utilizing write_image we can save our plot to a file. We can use this file to later log with rubicon_ml.
[4]:
scatter_plot = px.scatter(df, x="direction", y="frequency", color="strength")
scatter_plot.write_image("saved-scatter-plot-for-logging.png")
We can also create a plot and covert it to bytes to save it in memory. Using to_image we can convert our plot to bytes.
[5]:
bar_plot = px.bar(df, x="direction", y="frequency", color="strength")
bar_plot_bytes = bar_plot.to_image(format="png")
Logging your plot
In rubicon_ml , artifacts are a catch-all for any other type of data that can be logged to a file. We can use artifacts to capture information that doesn’t fall into the experiment, dataframe, feature, and parameter categories.
Leveraging artifacts, plots can be logged just by passing its file location in the data_path argument to project.log_artifact().
[6]:
project.log_artifact(
    name="scatter plot",
    data_path="saved-scatter-plot-for-logging.png",
    description="saved scatter plot with path",
)
artifact_plot_from_file = project.artifact(name="scatter plot")
We can also log plots by passing its byte representation to the data_bytes argument to project.log_artifact() as well.
[7]:
project.log_artifact(name="bar plot", data_bytes=bar_plot_bytes)
artifact_plot_bytes = project.artifact(name="bar plot")
Retrieving your logged plot programmatically
Since the PNG representations of both plots were logged, we can retrieve our artifact plots programmatically. Using io and PIL we can visualize our plots as PNG images.
[8]:
import io

from PIL import Image


imageScatterPlotStream = io.BytesIO(artifact_plot_from_file.data)
scatter_plot_image = Image.open(imageScatterPlotStream)

imageBarPlotStream = io.BytesIO(artifact_plot_bytes.data)
bar_plot_image = Image.open(imageBarPlotStream)
Finally, view the two images using display.
[9]:
display(scatter_plot_image)
[10]:
display(bar_plot_image)

We have logged our scatter_plot with Rubicon, so we can remove the file created earlier.
[11]:
!rm saved-scatter-plot-for-logging.png