View this notebook on GitHub or run it yourself on Binder!
Experiments Table
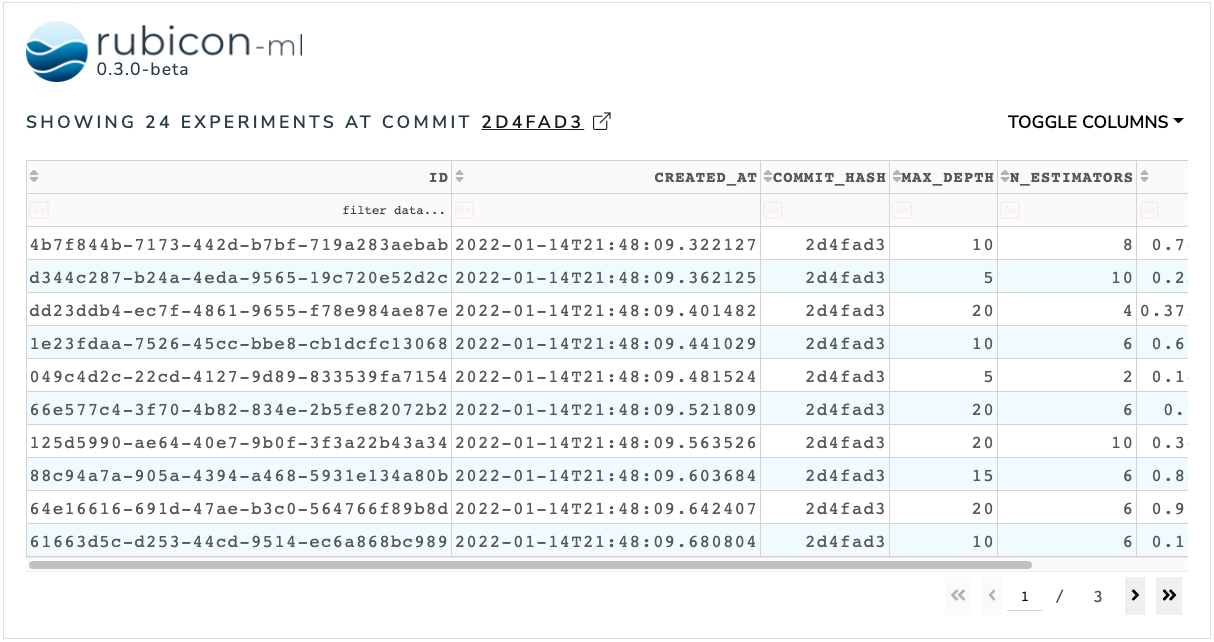
The experiments table is used to visualize all the experiments logged to a given project, as well as the metadata, parameters, and metrics logged to each of those experiments. Users can filter and sort the data in the table to easily explore and interpret results logged to the experiments.
When present in a rubicon_ml.viz.Dashboard, an experiments table acts a controller to select the experiments visible in the other widgets in the dashboard.
The table itself is a Dash data_table. More information can be found in the Dash documentation.
[1]:
import random

from rubicon_ml import Rubicon
from rubicon_ml.viz import ExperimentsTable
First, we’ll create a few experiments and log some parameters and a metric to them.
[2]:
rubicon = Rubicon(persistence="memory", auto_git_enabled=True)
project = rubicon.get_or_create_project("experiment table")

for i in range(0, 24):
    experiment = project.log_experiment()
    experiment.log_parameter(name="max_depth", tags=["show me"], value=random.randrange(5, 25, 5))
    experiment.log_parameter(name="n_estimators", tags=["show me"], value=random.randrange(2, 12, 2))
    experiment.log_parameter(name="extra_parameter", value=random.randrange(0, 2))
    experiment.log_metric(name="accuracy", tags=["show me"], value=random.random())
    experiment.log_metric(name="extra_metric", value=random.random())
Now, we can instantiate the ExperimentsTable object with the experiments we just logged and view the table right in this notebook with show. The Dash application itself will be running on http://127.0.0.1:8050/ when running locally. Use the serve command to launch the server directly without rendering the widget in the current Python interpreter.
Note: The parameters and metrics shown when the ExperimentsTable first renders can be controlled by the class’ other input arguments. The configuration below will only show the metrics and parameters tagged with “show me” when the table first renders.
[3]:
ExperimentsTable(
    experiments=project.experiments(),
    parameter_query_tags=["show me"],
    metric_query_tags=["show me"],
).show()